Designing Templates
In this section, you will learn how to design a template and add elements namely geospatial elements, text media elements, and statistics elements.
You can design a template in three easy steps:
-
Create a template
-
Create a layout
-
Add design elements
Think of templates as a ready-made base or canvas. You can simply drag and drop design various design elements on this ready-made base or canvas to create a template for reports. Elements are the building blocks of a creating a report template. These design elements are classified as per their use cases in building a template. For example, layout, geospatial data, text media, and statistics.
Currently the following elements are available:
Layout
-
Container: The container element works as the container or the holder of all other elements. Use this element to create a structured, well-formatted template.
-
Grid: The grid element works as the grid element in the template. Use this element to insert a 2 x 2 grid. You can add, delete, and merge columns and rows as needed.
Geospatial
-
Interactive Map: The interactive map element displays a 3D Map element in the report. When a report is created using this element in the template, the interactive map element displays a layer that you want to showcase in the report. Use this element to insert an interactive map in a report.
-
Metadata Label: The metadata label element displays the metadata of the layer that you want to showcase in the report. Use this element to insert metadata information of a layer in a report.
Text Media
-
Text Box: The text box element displays a block for inserting text. Use this element to add short description or text in a report.
-
Image: The image element displays a block for inserting an image. Use this element to add an image for visual context or reference to the report or logo/brand of an organization.
Statistics
- Table: The table element displays a table block. Use this element to insert a 3 x 3 table with headings in a report template.
Creating a template
Get started with create a template.
To create a template, do the following:
-
Login to the platform.
-
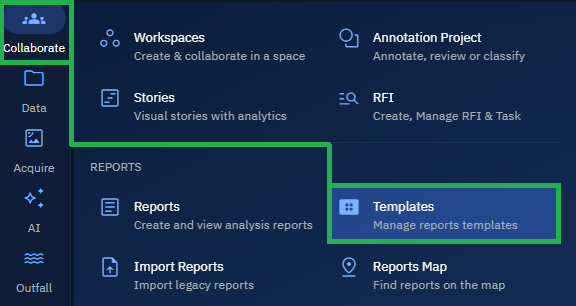
Click the Collaborate module, and then click the Templates sub-module.
The Templates Dashboard is displayed.
- In the Templates Dashboard page, click the Create New Template tile.

The New Template dialog box is displayed.
-
In the New Template dialog box, do the following:
-
Type the name of the template in the Template Name field.
-
Click the Size Presets drop-down list to select the size of the template (A1, A2, A3, A4, Letter, Legal, Custom) and then proceed to select the orientation of the template (Portrait and Landscape)
-
Adjust the Width and Height of the template.
-
Select a Background color of the template.
-
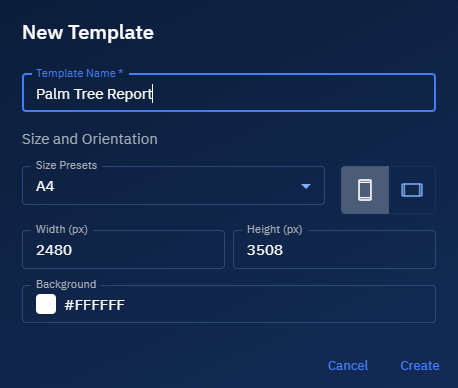
- Click the Create button.
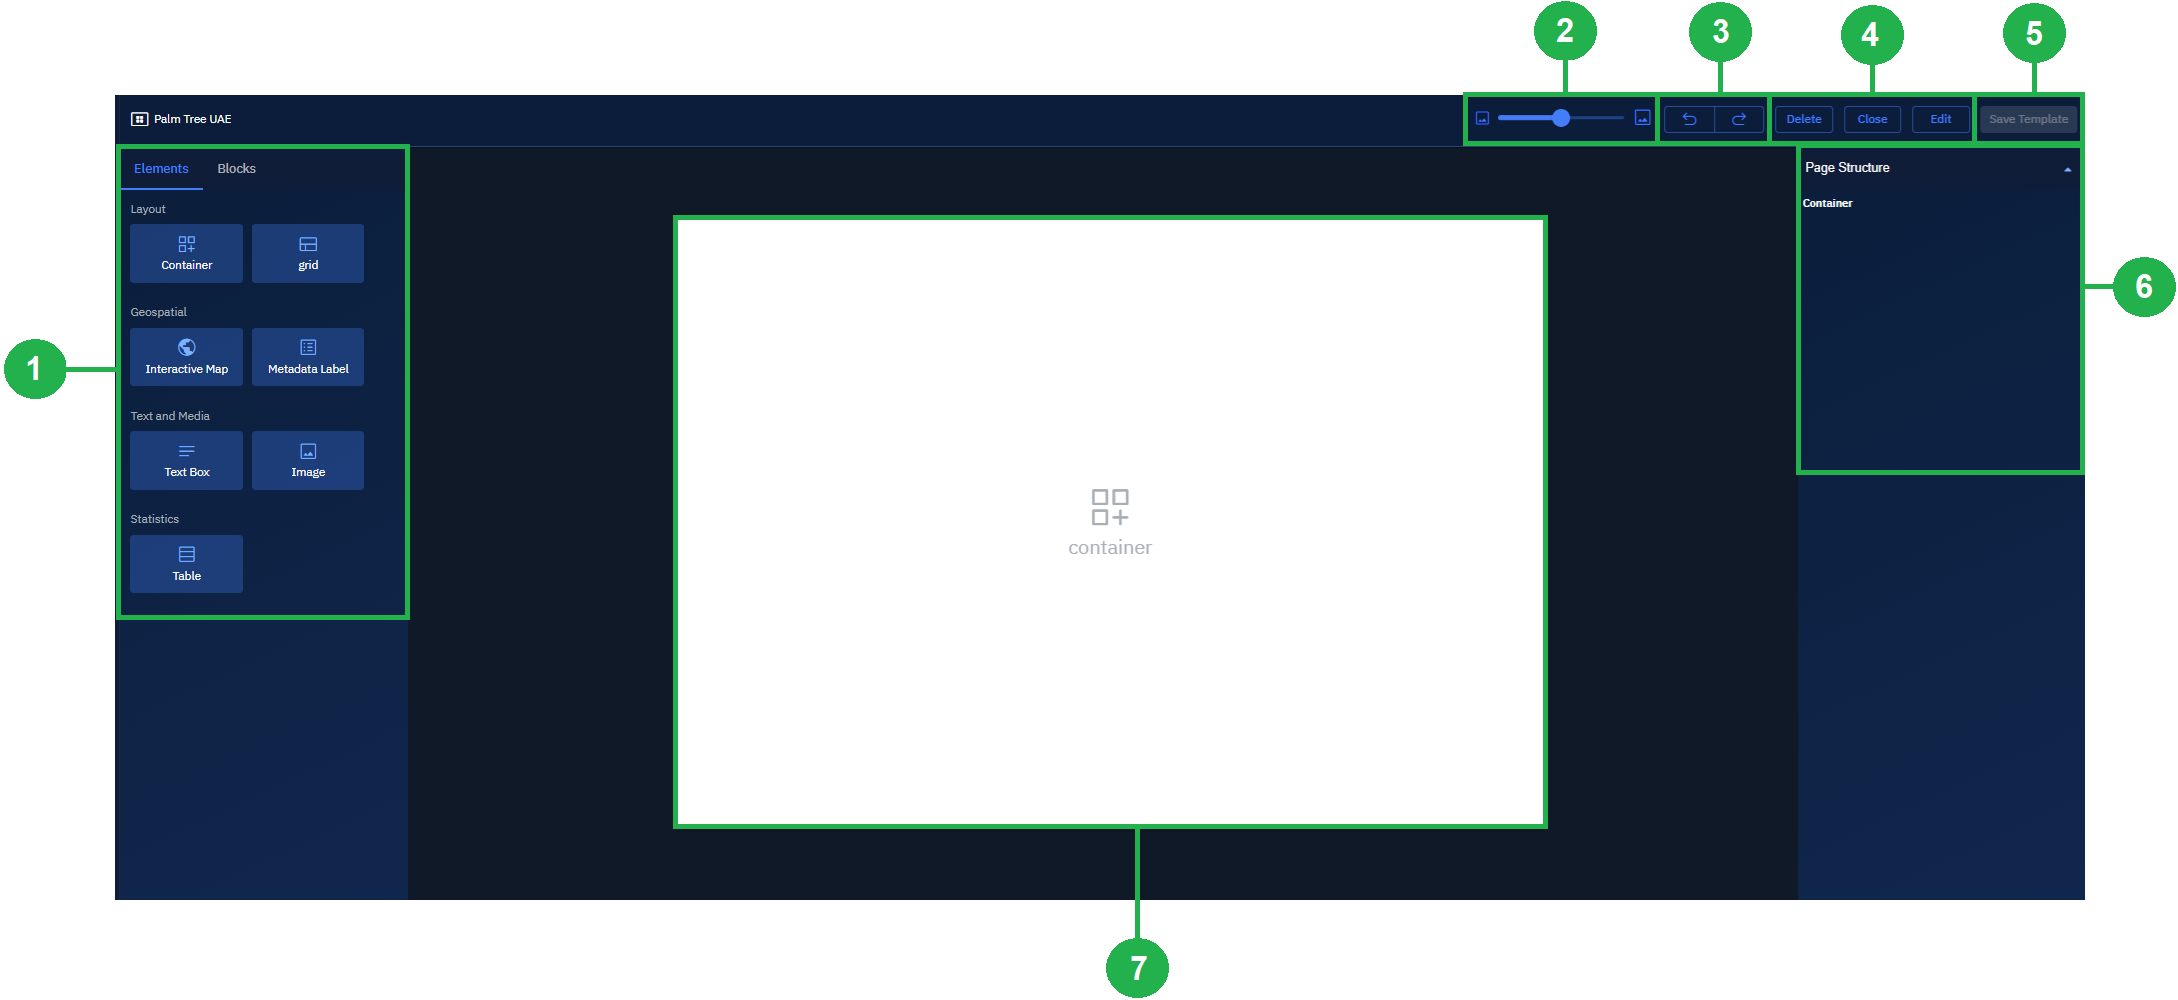
A new template is successfully created. The new template page displays the following:
-
Elements and Blocks: Use to design elements and blocks to create a template.
-
Zoom-in and Zoom-out: Use to zoom-in or zoom-out of the canvas
-
Undo and Redo: Use to undo or redo actions
-
Delete, Close, and Edit Template: Use to permanently delete template, close the template without saving, or simply edit the template.
-
Save Template: Use to save the changes and exit the template creation window.
-
Page Structure: Use the modify the layout and styling of elements.
-
Blank Canvas: Drag and drop elements and/or block on to the canvas to start building a template.
Creating a Layout
Layouts are containers of the design elements. You can use the container and the grid to set up a layout of the template.
To create a layout, do the following:
-
Continue with the template you created in the preceding step and open the template.
-
Do the following:
-
Drag-and-drop the Container element.
-
Drag-and-drop the Grid element, and then proceed to add ore move rows or columns as needed. You can also press CTRL and select two rows or columns and merge.
-
Repeat the preceding steps in case your template design demands a few more container and/or grid elements.
Adding Design Elements
In this section, you will learn how to add the building blocks or design elements to create a well-formatted, visually appealing template.
Adding Geospatial Element
As the name suggests, you can add an interactive map and the metadata label elements.
When you add the interactive map element to the template, you can display a layer in this space that you want to showcase in the report. In addition, you can also set it up to display the following information in the report:
- Coordinates
- Date
- Compass
- Location
- Graph
- Table
- Scale
Furthermore, you can add the metadata element to display the following information in the report:
- Acquisition Date from Source
- Acquisition End Date
- Acquisition Start Date
- Created By
- Description
- File Name
- Ingestion Date
- Created At
To add geospatial element, do the following:
-
Continue with the template with the container and grid elements.
-
Do the following:
-
Drag-and-drop the Interactive Map element, select the element, then and proceed to select one or more information to display in the report:
-
Drag-and-drop the Grid element, select the element, and then proceed to select a label to display in the report.
-
To add more labels, simply drag-n-drop the grid elements and select a label for each element to display the labels in the report.
Inserting text media element
As the name suggests, the text media element enables you to add the text and image elements in the template.
To insert text media, do the following:
-
Continue with the template with the container, grid elements, and then geospatial elements.
-
Do the following:
-
Drag-n-drop the Text element, select the text element, and then proceed to type your message or content. For example, Preview Report, Description, and so on.
-
Drag-n-drop the Image element, select the image element, and then proceed to click the Add Image button to upload an image that adds a visual context to the report.
Inserting statistics element
Use the statistics element to display 'category and detections' table in report.
To insert statistics element, do the following:
-
Continue with the template with the container, grid elements, and then geospatial elements.
-
Drag-n-drop the Statistics element, select the statistics element, and then proceed to click one of the following:
-
Detections: The table displays Category and Count table
-
Custom: The platform enables you to add and remove rows and columns and clear the table content.
Saving Template
After you have designed the template, you can go ahead and save the changes.
To save a template, do the following:
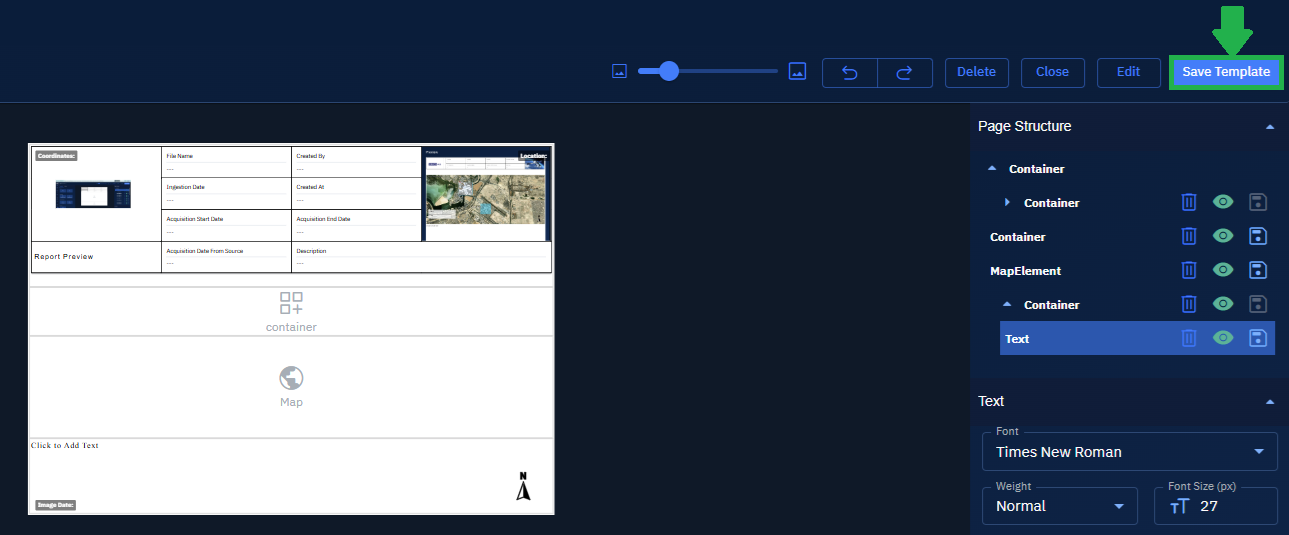
- Click the Save Template button to save the design.
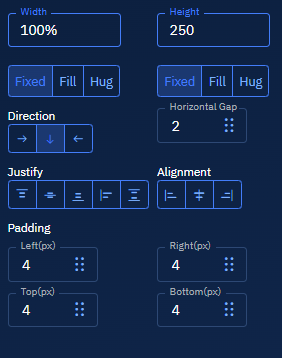
Editing Elements
After you drag-n-drop the elements on the template canvas, you can simply select any of the elements and proceed to edit the layout and the styling in the Page Structure panel.
In the Page Structure panel, you can make changes to the Layout and the Styling of any feature in the template.
Layout
In the Layout panel, you can edit the element to do the following:
-
Adjust the height and width of the element
-
Direction of the element
-
Justify and Alignment of the element
-
Add padding to the element from all four sides
Styling
In the Styling layout, you can edit the element to do the following:
-
Add a solid color, gradient, or image as background on the template
-
Opt for a no border, line border, or dotted border
